Top Camera Based Inspection Systems for Global Buyers
Choosing a camera-based inspection platform is a practical decision with direct effects on product quality, production speed, and operating costs. Global buyers must compare more than camera resolution or advertised inspection rates. Lighting, lens selection, image-processing software, and line conditions all influence results. Small changes in product color or surface texture can affect defect detection. A system that performs well in a demonstration may need adjustment on a busy production line. Real conditions matter.
A Camera Based Inspection System can identify visible defects, verify dimensions, read codes, or confirm that components are present. The right configuration depends on the product, inspection task, and acceptable error rate. Buyers should ask suppliers for test results using representative samples, clear performance limits, and details about integration and ongoing support. Requesting a live trial can reveal issues that brochures overlook. It takes time, but it can prevent costly assumptions.
This guide introduces camera-based inspection options and the features buyers should evaluate across different applications. It also considers installation, software compatibility, maintenance, and supplier communication. Specifications are useful, but they do not tell the whole story. Some performance claims may be difficult to compare directly, especially when testing methods differ. Buyers should document their own requirements and verify critical claims before purchase. A careful review supports a better-informed decision, though no inspection system removes the need for sensible process checks.
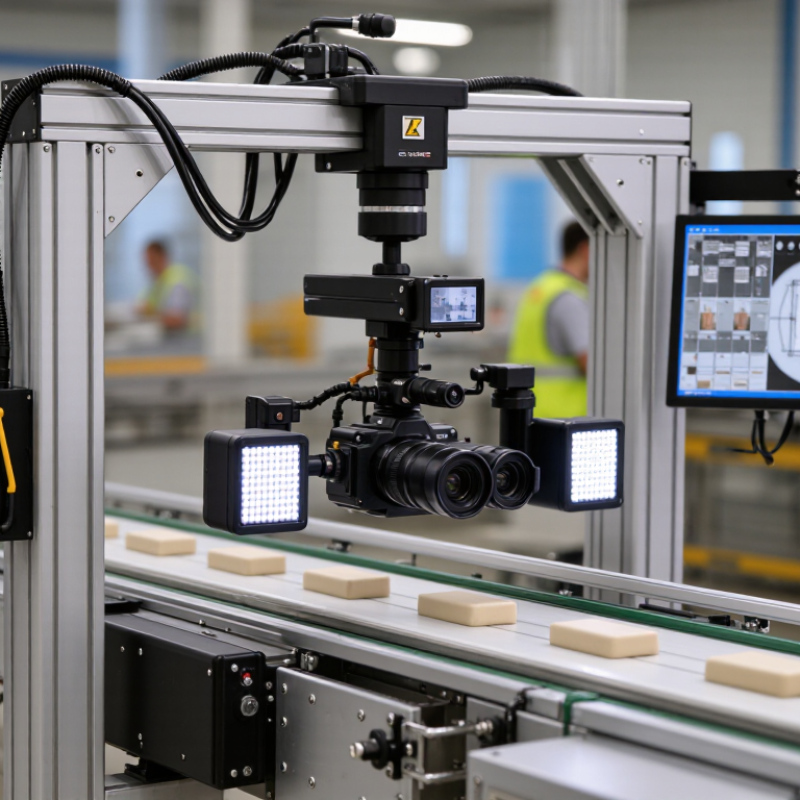
Define Inspection Requirements by Defect Size, Line Speed, and Field of View
Camera selection should begin with the smallest defect that must be detected, not the highest advertised resolution. If a scratch is barely a few pixels wide, its edges may disappear in noise or uneven lighting. Set a practical pixel target across that defect, then test it on real samples. A clean laboratory image can be misleading. That matters.
Line speed determines exposure time and image-processing capacity. A fast-moving package may blur during a long exposure, while a short exposure can leave dark areas under weak lighting. Use an encoder or a stable trigger to capture each item consistently. Then verify that the system processes every image before the next one arrives. Test it live.
Field of view connects coverage with detail. A wide view can inspect an entire panel, but it spreads available pixels across more area. A narrow view gives finer detail, yet may miss defects near the edges or between camera zones. Check lens distortion, working distance, and the actual inspection area. Reflective surfaces and product variation can still cause inconsistent results, so include difficult samples in the trial. The right balance depends on the defect, line, and viewing conditions together.
Top Camera-Based Inspection Systems for Global Buyers — Define Inspection Requirements by Defect Size, Line Speed, and Field of View
This chart shows the calculated number of horizontal pixels spanning each defect, assuming a 4,096-pixel-wide image. Pixel coverage is calculated as defect size × image width ÷ field of view. Smaller fields of view provide more pixels per defect; actual detection performance also depends on optics, contrast, lighting, and image processing. Line speed should be evaluated separately because exposure time and object motion can cause blur.
Compare 2D, 3D, Line-Scan, and Smart-Camera Systems
A 2D system inspects flat surfaces for missing labels, print defects, or color changes. It is often a practical choice when parts stay level and lighting remains consistent. A 3D camera measures height and shape, helping detect uneven seals, dents, or misplaced components. Line-scan systems capture moving products one narrow strip at a time, making them useful for continuous webs or fast conveyors. Smart cameras combine imaging and processing in one unit. They save cabinet space, but complex tasks may exceed their computing limits.
Small footprint. MarketsandMarkets’ 2023 Machine Vision Market report valued the market at USD 12.1 billion in 2023 and forecast USD 17.2 billion by 2028, a projected 7.3% annual growth rate. Forecasts are not guarantees.
Selection depends on the defect, product speed, and available installation space. IFR’s World Robotics 2024 report recorded 541,302 new industrial robots installed worldwide in 2023, reflecting the scale of automated production where inspection may be needed.
For reflective metal, test lighting before comparing camera specifications; glare can hide a defect in a high-resolution image. For tall or uneven items, verify 3D measurements against known reference parts. Line-scan setups also need steady product movement and careful calibration.
A useful trial uses actual production samples, including awkward edge cases. One weakness in many evaluations is testing only clean, ideal parts. That can make a system look more reliable than it is.
Evaluate Sensor Performance Using EMVA 1288 and ISO 12233
For camera-based inspection, sensor claims only matter when test conditions are clear. EMVA 1288 provides a repeatable way to examine key sensor characteristics, including quantum efficiency, temporal dark noise, saturation capacity, and dynamic range. Ask for the report, not just a headline figure. Check sensor temperature, illumination wavelength, exposure time, and whether results describe the bare sensor or a complete camera.
ISO 12233 addresses spatial resolution and spatial frequency response using defined chart-based methods. In practical buying, this helps reveal whether fine edges remain distinct, not merely how many pixels appear on a specification sheet. Look for the chart type, capture distance, focus procedure, and processing settings. Sharpening can make edges look crisp while masking weak optical or sensor performance. Small details matter.
Use both standards as complementary evidence. EMVA 1288 describes sensor behavior under controlled measurements; ISO 12233 evaluates image detail. Neither guarantees reliable defect detection on your production line. Test the intended lens, lighting, working distance, and target materials before comparing systems. Keep raw files when possible, and repeat measurements after warm-up. Results can drift. I would treat a tidy chart score cautiously if the test setup differs from the factory floor. That is not always convenient, but it is honest.
Match Throughput to GigE Vision Rates: 1, 2.5, 5, and 10 Gb/s
Selecting a camera-based inspection system starts with image size, frame rate, and pixel format—not the advertised link speed. The Ethernet Alliance’s 2024 Ethernet Roadmap includes 1, 2.5, 5, and 10 Gb/s Ethernet rates. Their theoretical ceilings are 125, 312.5, 625, and 1,250 MB/s before protocol overhead. Actual image throughput is lower, and network traffic can reduce it further. Margins matter.
For example, a 5-megapixel monochrome camera at 30 frames per second generates about 150 MB/s before packet overhead. A 1 Gb/s link cannot carry that stream continuously. A 2.5 Gb/s connection offers more headroom, but several cameras may quickly consume it. A 12-megapixel monochrome camera at 20 frames per second produces roughly 240 MB/s, making 5 Gb/s a more practical starting point. These figures are calculated from pixel count and frame rate; they are not guaranteed system performance. Exposure settings, bit depth, cabling, and host storage all matter. A neat spreadsheet can still mislead.
Tips: Test at the intended resolution and frame rate. Measure sustained throughput, not a short burst. Leave room for overhead and future inspection tasks. If results fluctuate, review camera triggering and switch configuration before adding bandwidth.
Assess Global Compliance, Integration, and Total Cost of Ownership
A camera-based inspection system can look impressive during a demonstration, yet global deployment depends on details beyond image accuracy. Confirm that equipment documentation, electrical ratings, safety features, and data-handling practices suit each destination market. Requirements can differ by country and industry, so qualified local teams should verify current obligations before purchase. Ask for test records using your own parts, including dull metal, reflective labels, and items with slight color variation. Real defects are rarely as tidy as demo samples. Record the lighting, lens, camera settings, and acceptance thresholds. These details help explain results during audits and reduce disputes between shifts.
Integration deserves equal scrutiny. Confirm that the system exchanges inspection results with existing controllers, production software, and reject mechanisms through agreed data formats and clear fault signals. Run a line trial at normal speed, then test restart behavior after a network interruption. Small delays matter. A few extra seconds per batch can create queues near packing. Estimate total ownership costs over a realistic service period, including installation, operator training, spare lighting, calibration, software updates, and downtime. Request regional service response times, not just a global promise. A cheaper unit may cost more later. Forecasts remain imperfect, so document assumptions and revisit them after the first production quarter.



 Customer Support
 Request Sample
 Contact